The 2020 Map of the Nonprofit Economy
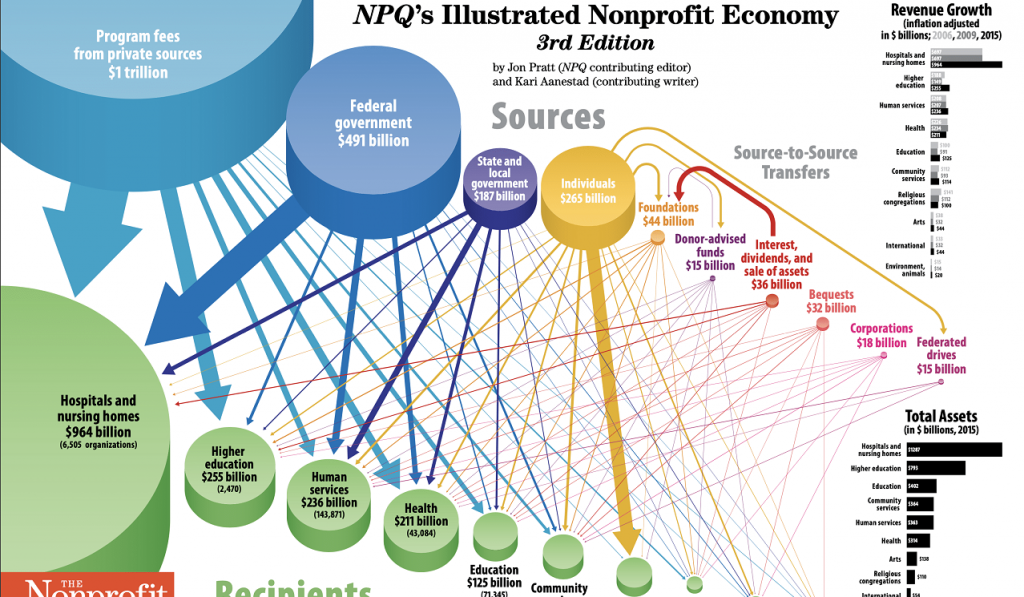
NPQ’s Illustrated Nonprofit Economy, 3rd Edition” portrays the revenue flows of the sector that go to US charitable nonprofits.
nonprofits, trends, infographics
You are using an outdated browser. Please upgrade your browser or activate Google Chrome Frame to improve your experience.
Begin typing your search above and press return to search. Press Esc to cancel.
NPQ’s Illustrated Nonprofit Economy, 3rd Edition” portrays the revenue flows of the sector that go to US charitable nonprofits.
nonprofits, trends, infographics
+ There are no comments
Add yours